 Conservative
  Search
 Trending
 Current News
We support our Publishers and Content Creators. You can view this story on their website by CLICKING HERE.
The former president is performing better in both the national polling average and in battleground states.
With less than two weeks until the general election, former President Donald Trump is performing significantly better in national and battleground state polling than he did in both 2016 and 2020.
On the same day in 2020, Trump trailed President Joe Biden by 7.9 percentage points.
In 2016, he trailed former Secretary of State Hillary Clinton by 6.1 points.
Trump, who’s making his third run for the White House, ultimately lost the popular vote in both 2016 and 2020.
The polling averages published on Oct. 22 show Trump led the Democratic Party’s candidate in all seven battleground states—Arizona, Georgia, Michigan, Nevada, North Carolina, Pennsylvania, and Wisconsin—that may well decide the outcome of the Electoral College.
Related Stories
10/23/2024

10/22/2024

The former president is performing better in each state than he did in 2016 and 2020.
Top pollsters in the United States say this could be interpreted as a sign that polls are doing a better job of capturing the on-the-ground sentiment of voters than they had in the past two presidential elections.
They also said the polling is a significant indicator that Trump is running a close race with Vice President Kamala Harris and may well have the advantage heading into Election Day.
“It is a dramatically even race,” Don Levy, the director of the Siena College Research Institute, told The Epoch Times. “[It’s] far more tightly contested according to polling than the last couple of elections.”
“Right now, he looks very much more viable than he did in 2016 and 2020,” David Paleologos, the director of the Suffolk University Political Research Center, told The Epoch Times.
Mark Mitchell, Rasmussen Reports’ head pollster, said his polls indicate that “Trump is locked in to win the national popular vote.”
Methodology Improvements
In his past two runs, Trump exceeded the expectations set by statewide polling in the seven battleground states.
According to a comparison of the final vote count published by each state’s election authorities and each state’s average polling about two weeks before Election Day, Trump overperformed polling by about 5.8 percentage points in 2016.
Clinton was projected to win all seven states except Georgia in 2016. Trump won all but Nevada.
In 2020, the projections were more accurate.
Trump beat his polling by about 3.2 percentage points. However, Biden was projected to win all seven swing states, and he took them all but North Carolina.
Levy and Paleologos told The Epoch Times that major pollsters improved their methodologies in the years following 2016 and 2020.
“There simply wasn’t a tremendous amount of high-quality state-level polling in 2016,” Levy said.
Siena, which publishes its polls in partnership with the New York Times, examined what went wrong in 2016 and tried to correct it in the following election years.
Specifically, Levy said statewide polls undercounted Trump supporters because they did not recognize the demographics that back Trump.
First, there is a significant political divide between those who have a four-year college degree and those who do not.
Second, there is a similar gap between urban voters and rural voters.
The more educated voters living in cities and suburbs tend to vote Democrat more often than other Americans, Levy said.
This is especially true in Pennsylvania, Michigan, and Wisconsin.
In retrospect, Levy said, his organization’s 2016 polling—and those conducted by other prestigious pollsters—didn’t properly sample the right populations or weigh their responses appropriately.
In 2020, Levy said, pollsters using telephone surveys likely oversampled Democrat voters and undersampled Republican voters.
He said white-collar employees working from home were more likely to answer the phone and complete a survey than blue-collar workers who stayed on-site through the pandemic.
Moreover, Trump supporters were more likely to answer only some of the questions in a survey than those voting for the Democratic candidate.
If they had not completed the survey, their answers may not have been included in the final report.
Had they included those partial responses, Levy said polls would have been notably more accurate.
In 2024, Siena changed how it weighed answers, enacted strict quotas to reach the right demographics needed to produce an accurate sample, including partial responses, and called people back as much as possible in order to collect the opinions of the harder-to-reach respondents.
Based on what he’s seeing from other “high-quality polls,” there is significantly less variance in overall polling this year than there was in previous elections. This indicates pollsters across the board are learning from their mistakes.
“We either are going to be more accurate, or we have again systemically failed to capture some hidden trend within the electorate,” Levy said.
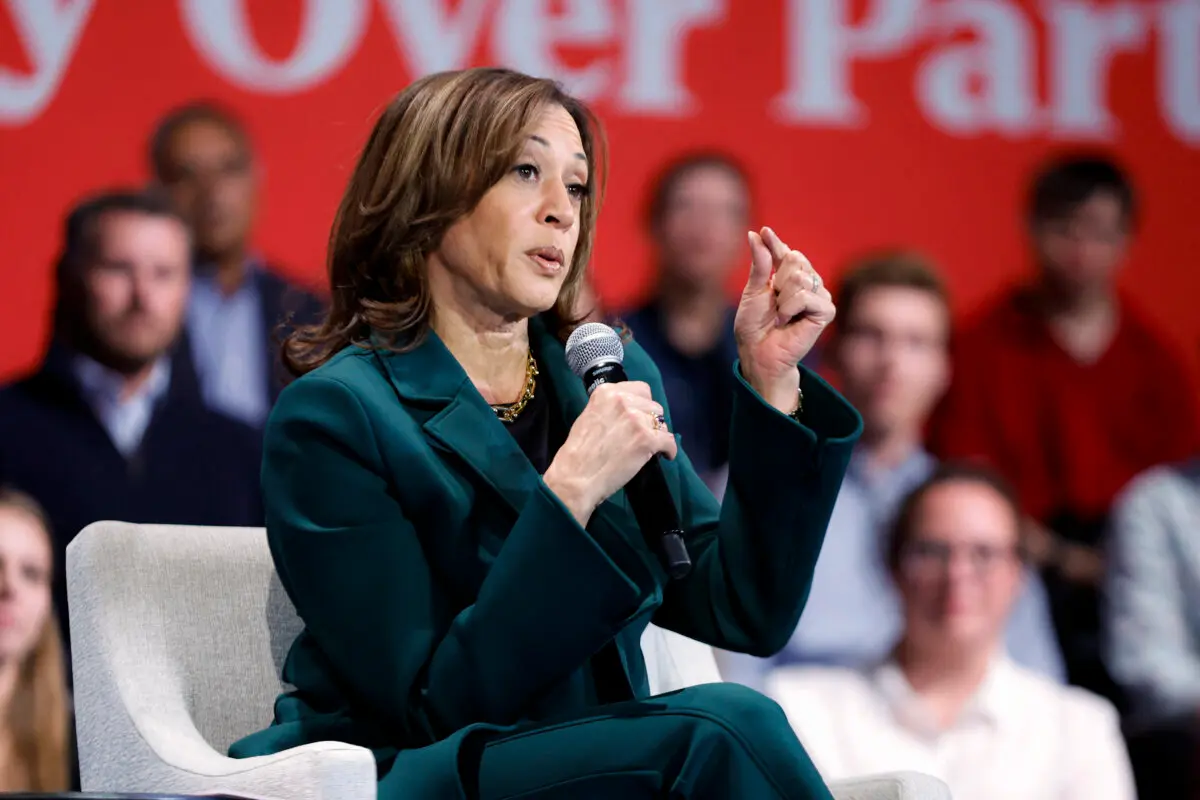
Vice President Kamala Harris speaks during a moderated conversation with former Rep. Liz Cheney (out of frame) at Sharon Lynne Wilson Center for the Arts in Brookfield, Wis., on Oct. 21, 2024. Kamil Krzaczynski/AFP
Confidence in Polling
Trump’s odds-defying victory shook public confidence in political polling.
Despite past failures, Paleologos said he believes Americans should continue to trust polls published by reputable organizations with a long track record of success.
However, in 2024, more polls than ever before are being published by organizations that may not use the same quality of sampling methods as more reputable pollsters.
“Polls that are published in 2024 include all of the apples, not just the good apples,” Paleologos said. “[Averages include] the bad apples and the rotten apples.”