
 Conservative
  Search
 Trending
 Current News
We support our Publishers and Content Creators. You can view this story on their website by CLICKING HERE.
Guest post by Joe Hoft at JoeHoft.com – republished with permission

EXCLUSIVE: Part 2 – Actuarial Analysis Unmasks Impossible Voter Turnouts at the Precinct Level in 11 Virginia Counties
This actuarial analysis from a guest contributor-actuarial professional outlines evidence of serious election fraud.
In the run-up to the 2020 General election, Virginia Democrats in full control of elections did a curious thing – they mandated that absentee mail-in ballot totals processed through the Central Absentee Precinct centers would not be reported at the precinct level but rather as a single total at the county level. It is believed by election integrity activists the reason for this decision is that it would facilitate mail-in ballot cheating, given that fraudulent votes would otherwise need to be allocated to precincts carefully to ensure that precinct turnout rates would appear realistic.
As long as there was no effort to find the actual absentee mail-in allocations and check precinct turnout statistics, no one would be the wiser.
However, we looked and found evidence of serious election fraud.
Redistricting Data, Registration Data, and Turnout Statistics
Before going further, it is important to understand that determining the allocation of mail-in ballots to precincts is not hard. In Virginia, voter registration lists and voter history lists are publicly available, so the names of voters and their addresses and voter history can be determined by associating the two files with their Voter IDs. Further, a precinct is associated with every address. With that information, allocation of absentee mail-in vote totals to precincts is an easy matter for the major redistricting data aggregation services. By subscribing to these services, vote totals by precinct are readily obtainable. For this analysis, precinct-level vote total data from two independent services were obtained and corroborated.
Registration totals by precinct are also readily available in Virginia from the Virginia Department of Elections website. Precinct turnout statistics are simply the precinct vote totals divided by the total registrations for the precinct.
The Analysis
This analysis sprang from the work of Capt. Seth Keshel, Executive Director of the Election Fairness Institute – specifically from his “Precinct Mapping Project” where counties were analyzed down to the precinct level to identify anomalies in reported election results that were not consistent with past elections, registration trends, population growth trends, and the redistricting data base information discussed above. It was found by leveraging his work under the Precinct Mapping Project, actual turnout statistics could be determined for those precincts being analyzed.
For this analysis, 11 Virginian counties were examined. The study included both the major Northern Virginia counties, as well as smaller counties around the State.
What We Found
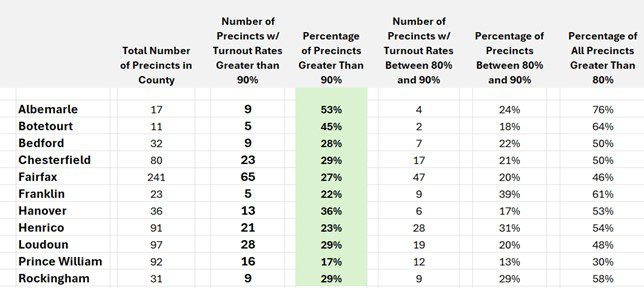
The headline findings for this analysis are captured in the following table. For each of the 11 counties, the total number of precincts is presented, as well as the number of precincts calculated as having turnout rates greater than 90% and precincts with turnout statistics between 80% and 90%. It would normally be assumed that very few precincts would have turnout statistics greater than 90%, and likely a limited number being between 80% and 90%.
Examination of the table reveals, however, that all 11 counties in the study exhibited an extremely unlikely number of precincts with unrealistically (if not impossible) turnout statistics.
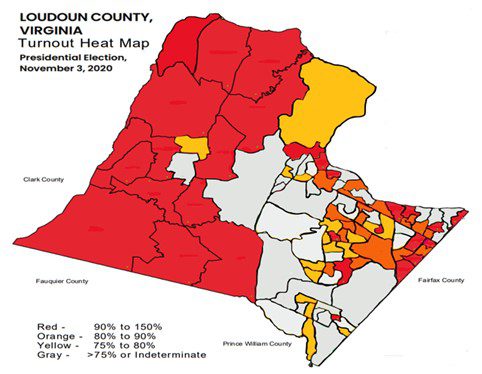
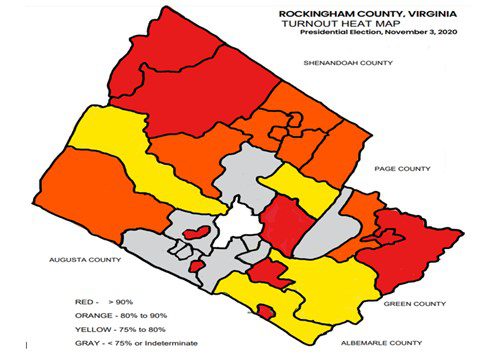
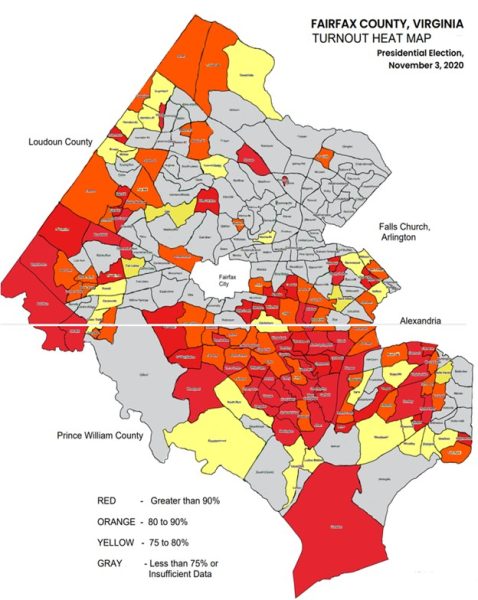
Heat Maps
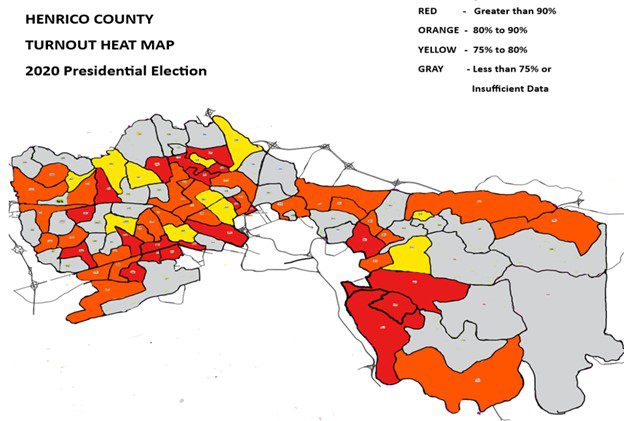
In his Precinct Mapping Project, Keshel prepared precinct-level “Heat Maps” for each county he analyzed, and color coded the precincts according to his assessment of the level of probable election fraud. Such visualization facilitated recognition of likely ballot-trafficking routes and hubs. This analysis leveraged that visualization tool as well. Precincts in red have turnout statistics greater than 90%, those in orange have statistics between 80% and 90%, those in yellow between 75% and 80%, and the remainder are in gray.
Illustration: Henrico County
Below is a precinct-level Turnout Heat Map for Henrico County. Keshel estimated more than 15,000 fraudulent votes were injected in the 2020 General election. The Turnout Heat Map for Henrico suggests that there were fraudulent ballots injected in the election in precincts along the Patterson Ave, I-64, and Staples Mill corridors, as well as immediately around Richmond and Mechanicsville.
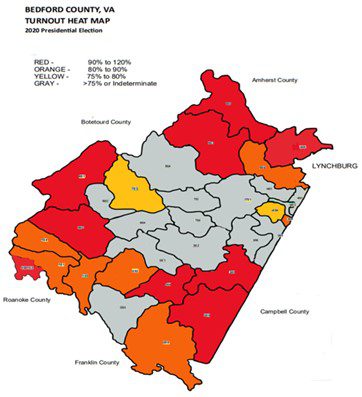
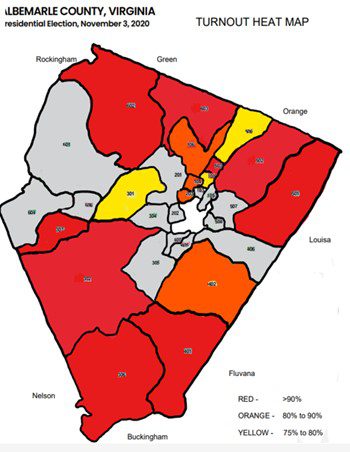
Other Counties
The Turnout Heat Maps for several other counties are presented below. Of interest was that every county, whether large or small, exhibited evidence of the fraudulent insertion of votes.
It Is Actually Worse Than That
Now, in addition to the unreasonable turnout statistics presented here, an additional adjustment must be provided to remove unsupported registrations on the rolls from the denominator in the turnout calculations to determine realistic turnout statistics:
Virginia’s voter rolls remain significantly inflated, with estimates of over 1,000,000 questionable registrations remaining on the rolls even after the Virginia Department of Election’s vaunted, but ineffective, clean-up efforts. As shown in a recent Gateway Pundit article[1], this alone materially distorts reported turnout statistics because ineligible registrations artificially inflate the denominator in the turnout calculations, materially depressing the turnout statistic calculation.
Further, it appears to be common practice by registrars in Virginia to include “Inactive” registrations along with “Active” registrations in the turnout calculations, typically reducing reported turnout statistics even more by between 2% and 3%.
Turnout statistics in Virginia are simply not believable.
Further, the analysis of turnout statistics and the geographic distribution of precincts with unrealistic turnout statistics as presented in the Heat Maps is suggestive of material fraud throughout Virginia in the 2020 General election, particularly around urban areas and along transportation corridors.
The findings presented here are part of a larger report which may be downloaded from https://vaanalytics.org/the-virginia-report
[1] Gateway Pundit October 18, 2024, article link – https://www.thegatewaypundit.com/2024/10/exclusive-shocking-actuarial-analysis-shows-that-bloated-voter/