 Conservative
  Search
 Trending
 Current News
We support our Publishers and Content Creators. You can view this story on their website by CLICKING HERE.
Despite some fans’ disapproval, the 2024 World Series between the Los Angeles Dodgers and New York Yankees is a highly anticipated match up of the best team from each league.
Based on expert opinion and predictions, as well as computer projection systems, it’s widely assumed that the series is between two evenly matched teams. Fangraphs, for example, has the Dodgers at 52.8% to win the series, with the Yankees at 47.2%. Another projection system, ZiPS, which is housed at Fangraphs and takes the starting pitchers into account, is even closer. The latest model run there put the series at quite literally 50-50.
In theory, it makes sense. The Yankees won 94 games in the regular season, the Dodgers won 98. New York’s run differential was +147, meaning they outscored their opponents by 147 runs over the course of the season. The Dodgers run differential was +156. Baseball Reference, which uses what they call a “Simple rating system,” where they take a team’s average run differential per game and adjust for strength of schedule, put the Dodgers at 1.0, with the Yankees at 0.8.
Sounds pretty evenly matched, doesn’t it? But how does that stand up to a closer look at both teams?

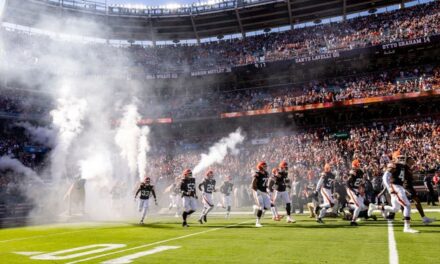
CLEVELAND, OH – OCTOBER 17: Aaron Judge #99 of the New York Yankees looks on from the dugout prior to Game 3 of the ALCS presented by loanDepot between the New York Yankees and the Cleveland Guardians at Progressive Field on Thursday, October 17, 2024 in Cleveland, Ohio. (Photo by Mary DeCicco/MLB Photos via Getty Images)
Yankees-Dodgers Have Some Key Differences
It’s widely assumed that the Yankees have a starting pitching advantage in the series. New York is expected to use Gerrit Cole, Carlos Rodon, Luis Gil and Clarke Schmidt to start all seven potential games, while the Dodgers are countering with Jack Flaherty, Yoshinobu Yamamoto, Walker Buehler and one likely bullpen game.
From a name value perspective, the Yankees seem to have a clear edge. But a closer look at their actual performance this season paints a different picture.
Yes, Gerrit Cole has been one of the best pitchers of his generation, with a dominant run from 2018-2023. But nerve inflammation in his arm at the start of the season set his season back, and even after his return, Cole hasn’t been nearly the same pitcher as in years past.
In 2019, at the peak of his powers, Cole posted a 2.50 ERA and 2.64 FIP with the Houston Astros, striking out 326 hitters in 212.1 innings. He struck out 39.9% of the hitters he faced, while walking just 5.9%; a remarkable 34% K-BB%. This season though, those numbers plummeted. Cole’s 3.69 FIP was the highest of any season since 2017 in Pittsburgh, and his K-BB% dropped to just 17.9%, again his worst mark since 2017.
Among starting pitchers with more than 90 innings pitched, that put Cole in a tie for 34th, behind Jared Jones, Freddy Peralta, Taj Bradley and Brandon Pfaadt. Jack Flaherty meanwhile, ranked eighth and Yamamoto 12th. Carlos Rodon was 28th, meaning the Dodgers top two starters easily outpaced the Yankees’ starters in one of the most important statistical categories.
Yes, Gil and Schmidt have outperformed Walker Buehler, but Gil’s line shows more weakness than the early season hype indicates. After the All-Star break, Gil had a 5.21 FIP, the result of walking over five hitters per nine innings. Not exactly encouraging.
A Look At The Bullpens
The two bullpens though, are remarkably similar. The Dodgers had an ERA advantage with their active roster pitchers, but by FIP, they were nearly identical. One disadvantage for New York? Their relievers walked 12.3% of hitters they faced against the woeful Royals and Guardians lineups. The Dodgers were baseball’s most patient team, and as we’ve seen throughout the postseason, late inning walks can easily spur big innings. LA’s bullpen, by contrast, walked 9.0% of hitters.
New York’s top relievers have also been heavily used thus far. Luke Weaver leads all postseason relievers with 10.1 innings pitched, despite playing just nine games. Clay Holmes and Tommy Kahnle have pitched 7.2 and 7 innings respectively, while the Dodgers have used their high leverage relievers like Blake Treinen for 8 innings, Evan Phillips for 6.2, and Michael Kopech for just 4.2.
Put another way, the Yankees have used their top three relievers for 24.2 innings in nine games, while the Dodgers have used theirs for 18.2 innings in 11 games. Whether or not the extra rest matters is up for debate, but it’s clear that manager Aaron Boone doesn’t have much trust in the rest of his bullpen.
As far as lineups, in the second half of the season with their active rosters, the Dodgers and Yankees rank second and third in hitting above average. Per wRC+, where 100 is the league average, the Dodgers have 129 wRC+ as a team, with the Yankees at 117.
Seemingly, in all three categories, the Dodgers have slight, but real, advantages. That’s where the 53-47 probability comes from. In the postseason though, small sample sizes and random variance make that gap feel much smaller. Given the Dodgers lack of depth in the rotation, the Yankees can feel confident in several matchups. But with the Yankees reliance on their top relievers, a long, close series might benefit Los Angeles in the late innings thanks to overexposure.
READ: There Might Be A Hidden Advantage For Teams In The MLB Playoffs