 Conservative
  Search
 Trending
 Current News
We support our Publishers and Content Creators. You can view this story on their website by CLICKING HERE.
To paraphrase Al Pacino in The Movie That Shall Not Be Considered a Godfather: Just when I thought I was out of the poll-gazing business, they pull me back in.
Advertisement
Now that we are 20 days out from the election, polling gets a lot more attention, and for good reasons. Pollsters want to get their most accurate numbers published in order to score well after the results of the election are known to establish their credibility in the next cycle. Voters begin to reach decisions on candidates up and down the ballot. Early voting becomes a bigger and more conclusive part of the picture. To paraphrase Kamala Harris, it’s a bigger deal at “20, 20, 20” than at “90, 90, 90.”
How does one read the polls, though? Typically, I keep my eye on aggregations, where trends are generally more reliable. RealClearPolitics has unweighted aggregations, and those clearly show trendlines favoring Trump at both the national and battleground levels, as I wrote on Monday. Nate Silver weights pollsters in his aggregation in an attempt to provide a more finely tuned predictive model, which has thus far shown Harris edging Donald Trump on the odds of victory.
Or at least that’s what his model showed until yesterday afternoon. Now Silver calls it a true toss-up:
Last update: 2:30 p.m., Tuesday, October 15. Well, we keep emphasizing that the forecast is really close. After another day of polls showing an essentially tied race in the Midwestern battlegrounds, it’s now literally 50/50. We’re just not seeing as many Harris +3 type numbers in Michigan, Wisconsin, and Pennsylvania as we did immediately after the debate. It hasn’t been a huge swing, but even a half point to a point makes a difference.
Advertisement
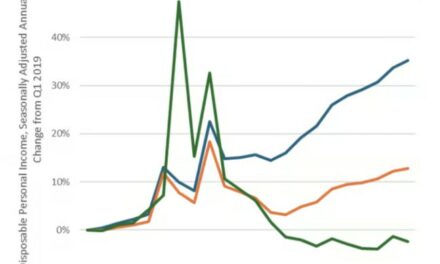
Frank Luntz followed it up with an observation not about the numbers but their direction. “The odds say 50/50,” Luntz remarked, “but the trendlines tell a whole other story.” And indeed they do, as Silver himself tweeted out:
Today’s update. It’s now literally 50/50.https://t.co/vsGVG18HHI pic.twitter.com/IynflBiMWb
— Nate Silver (@NateSilver538) October 15, 2024
RCP doesn’t do these kinds of calculations, so they have no direct comparison to the odds based on polling. However, RCP does track seven betting markets and aggregates their odds for each candidate, and the trendlines are even starker there. As I’ve proposed before, this measure appears to be both predictive and prophetic about the direction of polling in the week ahead:
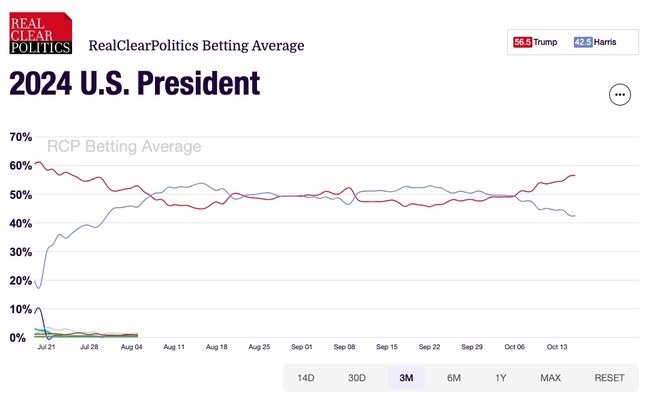 Take a look at the trendlines in both this graph and Silver’s. The Y-axis distortion gets created by the starting point for the RCP graph, which is eight days earlier than Silvers, but the pattern is otherwise similar –until about a week ago or so. On Silver’s chart, the trendlines cross at the 50% mark yesterday, while it happened in the betting-market aggregate on October 6.
That can be explained by the immediacy of betting markets and the non-immediacy of polling. Polls use scientific sampling to capture the public mood at that moment in time, but it usually takes a couple of days or more to collate and calculate responses for publication. For instance, four of the seven national polls that Silver uses for his model had collected responses only as late as October 8 or earlier. Only two had any responses from Sunday, and only one from Monday. That’s not Silver’s fault, but it shows how polling usually paints a picture that lags by a few days and sometimes longer than that. (One of Silver’s polls in his national model comes from data collected October 2-3.)
Advertisement
Betting markets may be more speculative than reliable by nature, but they have shown predictive value in this cycle when it comes to trending. Luntz warns his followers to watch trends rather than numbers for polling because voters are running out of time to make their decisions, and candidates are running out of time for reboots. That sharp split starting on October 6 and crescendoing to this day suggests that the next iteration of polling will trend sharply toward Trump at both state and national levels.
Furthermore, we can look no further than the Harris campaign for corroboration. For more than two months, they kept Harris and Walz as far from reporters and tough questions as possible. Neither have yet done a press conference, for that matter. They did a few local TV interviews and friendly podcasts, but those ended up backfiring on Harris. (Both trendlines show they did her no good at all, at the very least.) This week, they suddenly want Harris to do an interview with Fox News and are publicly teasing interest in Joe Rogan, two environments that they would have vetoed out of hand a couple of weeks ago. In fact, Trump arranged a debate on Fox for September 4 that Harris refused to consider — because the trendlines still looked good for her at that time.
Advertisement
The strategy from Team Kamala has changed because the race has changed, and now they are having to take a lot more risks. That tells us that the trendlines showing Trump moving ahead are not limited to the RCP and Silver models.